IoTDataViz
Data Visualization for the Internet of Things
THIS CHANGES EVERYTHING
The Internet of Things (IoT) is steadily approaching, with all industries, directly or indirectly, being affected by it. There is a lot of excitement around what this network of connected devices and sensors can and will become. Rightfully so, as this is just the beginning.
The future is going to be exciting.
With this massive network of possibilities comes a lot of opportunities worth exploring. Data Visualization provides us with a way to display this avalanche of collected data in meaningful ways that clearly present insights hidden within this mass amount of information. This can assist us in making fast, informed decisions with more certainty and accuracy than ever before.
It is thus vital for business professionals, developers, designers, entrepreneurs and consumers alike to be aware of the role that Visualization will and can play in the near future. It is crucial to know how it can affect the experience and effectiveness of IoT products and services.
QUESTIONS
As Data Visualization for the Internet of Things is still only gaining momentum, there are huge opportunities for those looking to get involved. Industries are now seeing the benefits that the collected data can provide. It is clear, once combined with the incredible technological innovation we are experiencing, that Data Visualization will play an enormous role in assisting us to make sense of this new era.
Having said this, it can be quite daunting when first approaching the field with its broad range of topics, technologies, developments and incredibly fast pace of change.
Questions like the following might come to mind:
Why is this currently happening and what is involved?
What role will Data Visualization play in future IoT Opportunities?
What are the IoT verticals and what application areas are there?
What exactly is involved in bringing these visualizations to life?
What kinds of data are we talking about and where will it come from?
What technologies and platforms currently exist for this purpose?
This resource was born as a result of addressing the above mentioned complexities and questions.
We will be exploring these and many more related questions and topics.
A SOLUTION
Our aim is to provide you with a comprehensive, curated resource on the topic of Data Visualization for the Internet of Things (IoT). To give you a solid foundation to work from while keeping you abreast with related future developments.
What you can expect:
Exploring the latest trends, technologies and developments of relevance
Delving into the latest tools, libraries, platforms and vendors
Provide you with quality original and curated content
Share relevant and useful resources on the topic
Highlight Events worth attending
Introduce you to thought leaders worth following
New articles and content will be published on a regular basis.
If this sounds of interest to you, please subscribe below to be notified when new content is available.
IOTDATAVIZ LONDON MEETUP

IoTDataViz London Meetup
Event Dates for 2017 Coming Soon
To find out more please visit the IoTDataViz London Meetup Page for the event. See you there!
HAVE A LOOK
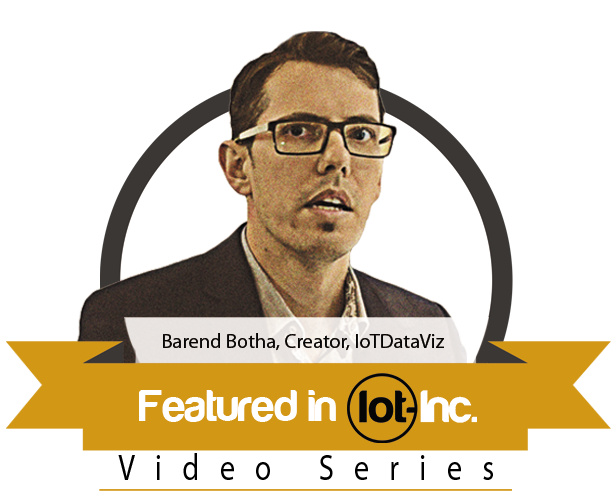
Telling Stories of Value with IoT Data Visualization
Also do have a good look through the the rest of the website for quality podcasts, interviews, articles and more.
www.iot-inc.com/storytelling-through-iot-data-visualization-video/
KEEP ME POSTED
If this sounds of interest to you subscribe below
Content Worth Sharing
If you already have some resources, projects or comments that you would like to share with us, or simply curious, please get in touch by using the form below.
We would love to hear from you!


